Game 6 of the NBA Finals took place just last week on June 13, 2019. The five games leading up to the championship match between the Toronto Raptors and the Golden State Warriors already had fans on the edge of their seats. Game 6 did not disappoint.
To cheer on their beloved Toronto Raptors, a record-breaking number of Canadians tuned in to Game 5 (over 13.4 million), making it the most-watched TV program in Canada in 2019 and the most-watched NBA game ever in Canada’s history. Even before the final match, half of the Canadian population (18.2 million viewers) had tuned into all or part of the 2019 NBA Finals.
With all the buzz in the lead up to the big night, we wanted to understand how such huge sporting event might impact the retail industry, so we looked at Criteo data to find out. And the results weren’t exactly what we expected.
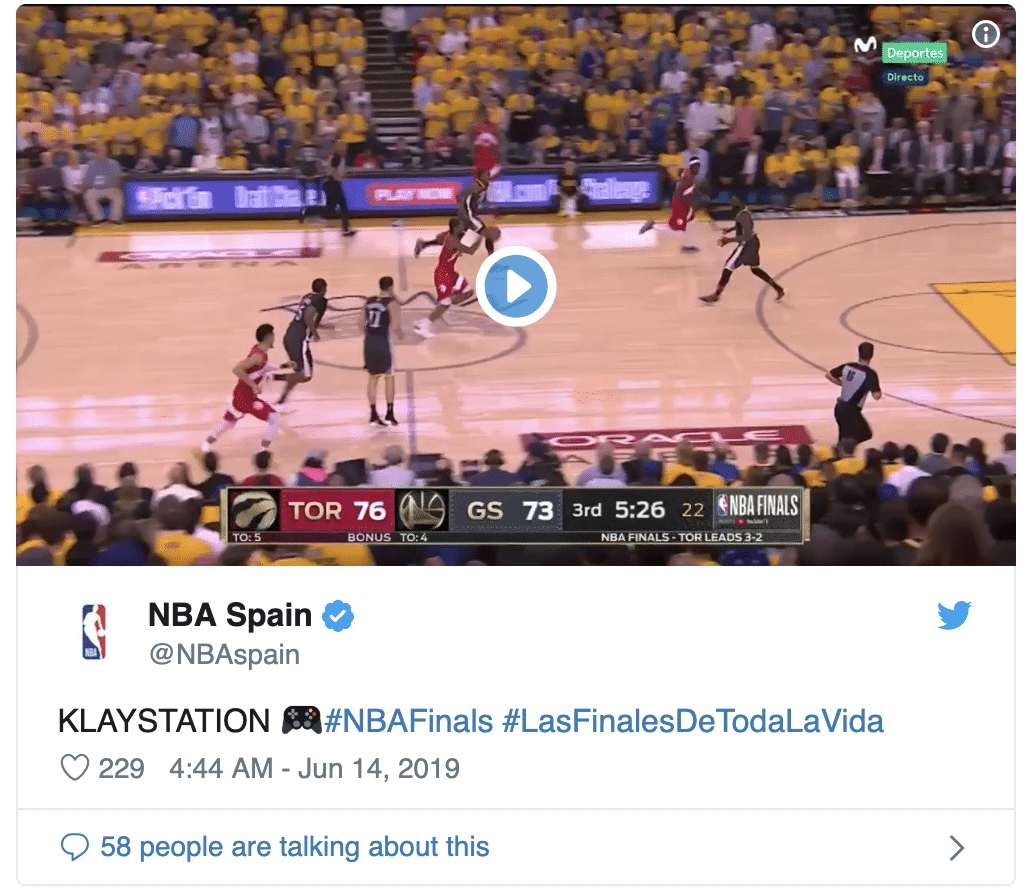
Pre-game started at 7pm EST, and the game ended almost five hours later, at 11:50pm EST. In between, a hard-fought battle ensued, marked by incredible shots, turnovers, and a superstar injury. Across continents, the Twittersphere went nuts:
Criteo’s global network of 19,500 retailers and brands and over $800 billion in annual sales gives us insight into shopping trends around the world. Here’s what we saw happen during Game 6:
The Fashion & Luxury Zone
Most weeks during the year, evening shopping peaks don’t reach daytime shopping levels. But during the NBA Finals, shopper activity actually surpasses daytime peaks. This was especially the case for fashion, like apparel purchases, as well as luxury items like jewelry.
Our theory? With TVs all turned to basketball, anyone who wasn’t totally into the game was doing some online shopping on the couch, instead. Starting from the pregame show until the middle of the second quarter, Fashion / Luxury sales steadily increased, reaching a peak of +71% compared to prior Thursdays. There was a noticeable decrease during the latter half of the second quarter and halftime show, but sales picked up again in the third quarter.
Most interesting, perhaps, was that at the point of Klay Thompson’s injury, near the end of the third quarter and the start of the fourth quarter, we saw sales drop down to normal.
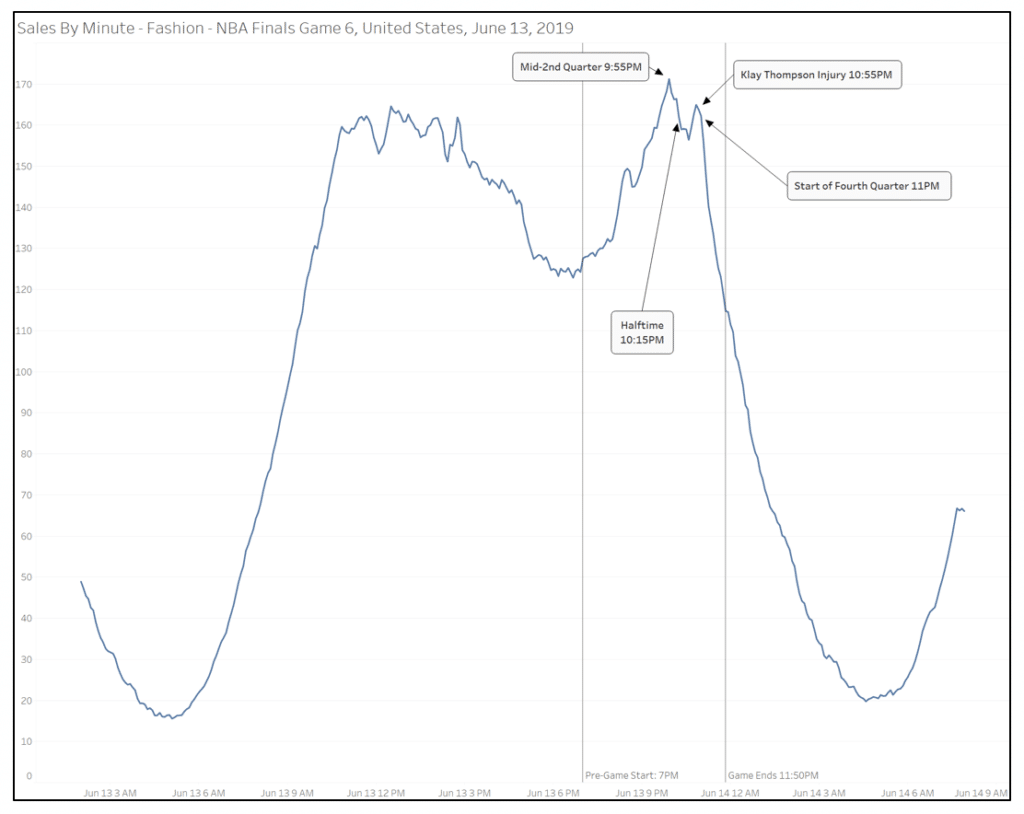
Source: Indexed values are the moving averages of 20-minute windows based on the average sales in the four Thursdays prior. Times are in EST. Criteo, Fashion/Luxury, US and Canada data.
With casual basketball fans shopping on their phones instead of watching the play-by-play, we still did see slowdowns during halftime and the Klay Thompson’s injury. This is probably a view of moments when shoppers did look up from their phones to look at the TV.
So what explains the slump toward the end? Probably more casual fans just tuning in to watch the fourth quarter… which some may say is the only part of an NBA game you need to watch.
A Time Out for Sporting Goods
During most weeks, evening shopping peaks in Sporting Goods are similar to daytime shopping trends. However, during the NBA Finals Game 6, shopping activity in this category was actually lower compared to daytime levels.
We did see a surge during the first half of the game, from +66% to +93%, compared to previous Thursdays But there was a drop at the start of the second half, then another drop at the fourth quarter. But then we saw a significant increase in the final minutes of the game, when sales surged by 98% compared to your average Thursday.
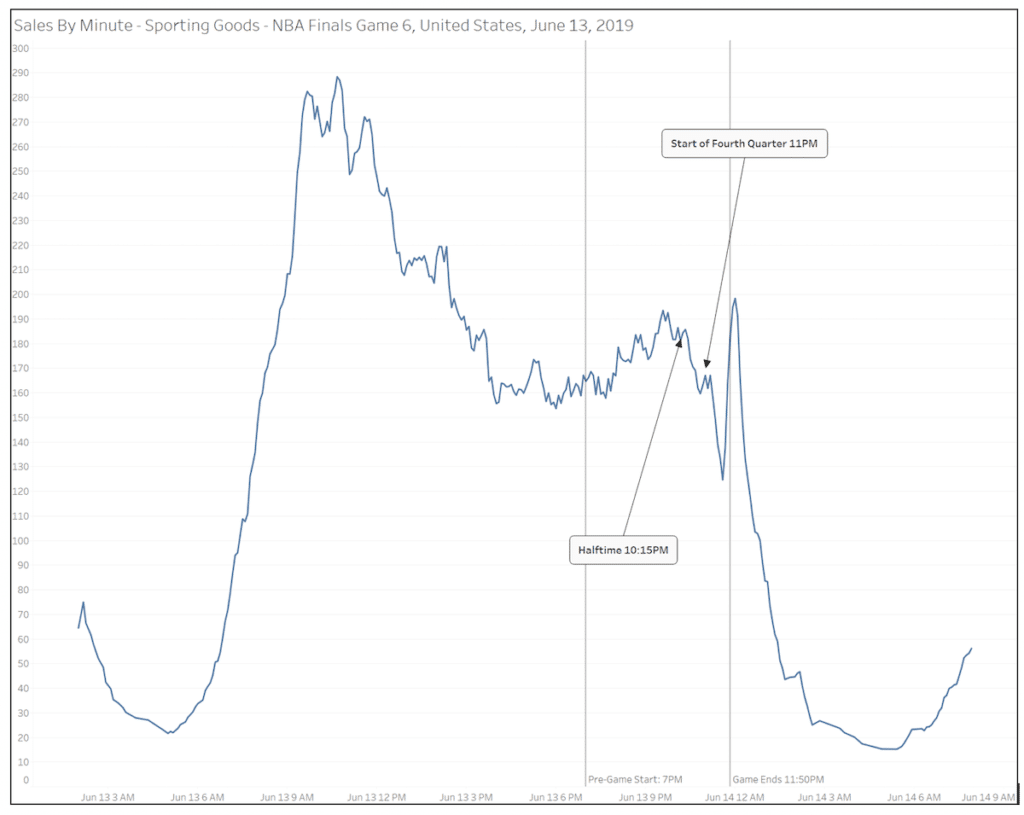
Source: Indexed values are the moving averages of 20-minute windows based on the average sales in the four Thursdays prior. Times are in EST. Criteo, Fashion/Luxury, US and Canada data.
What could be happening here? Waves of sports-savvy shoppers could be shifting from shopping to watching the game, especially during the run-up to the final buzzer.
Three-Point Counter-Intuition
When we usually look at data around sporting events, we see specific shopping increases for sporting goods especially. When we took a look at Super Bowl 2018, we noticed an increase of 422% in sporting goods purchases. This time, by analyzing data from other categories alongside pivotal moments in the game, we could actually see a bigger picture of shopper behavior… and hidden opportunities for marketers.
Want to see more data in action? Check out the Criteo Data Hub.


