In the midst of this very uncertain year, marketers are readying for another curveball: the US Presidential election. Here at Criteo, we wanted to understand if the 2020 election might impact holiday season sales, so we looked back four years to see what happened during the last Presidential election.
To help businesses prepare, we analyzed our data from 2016, including insights pulled from more than 500 US retail, auto, and real estate advertisers, to identify any patterns that all companies should anticipate as Election Day 2020 approaches.
Here are the highlights:
1. Many US consumers wait until after Election Day to buy expensive goods.
In 2016, the US Presidential Election Day fell on Tuesday, November 8. In the run up to this date, Criteo data shows that sales for retailers with average order values (AOV) under $1,000 didn’t change much: Compared to 2017, sales followed a stable trajectory, then saw a huge spike on Black Friday weekend beginning on November 25. As the graphs below show, a very similar trend happened the following year.
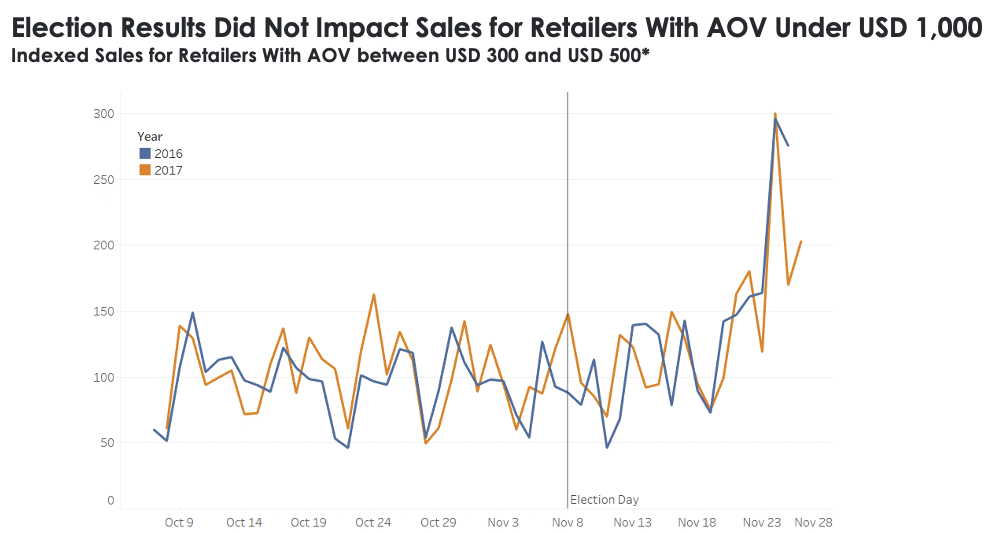
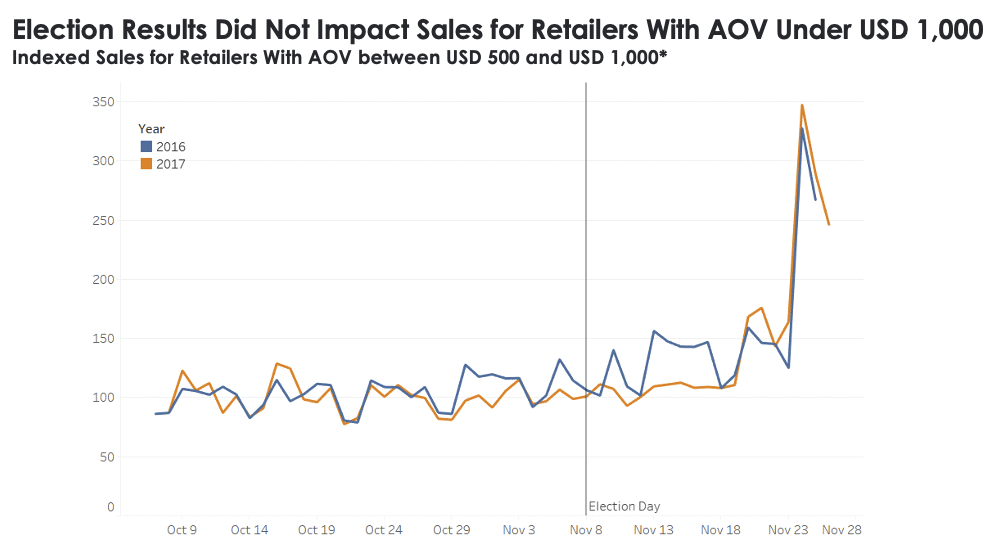
For big-ticket items however, purchasing trends took a different path: Sales for retailers with AOVs greater than $1,000 stayed at normal historic levels until Election Day, then catapulted to more than double what they were from October 7-21, 2016.
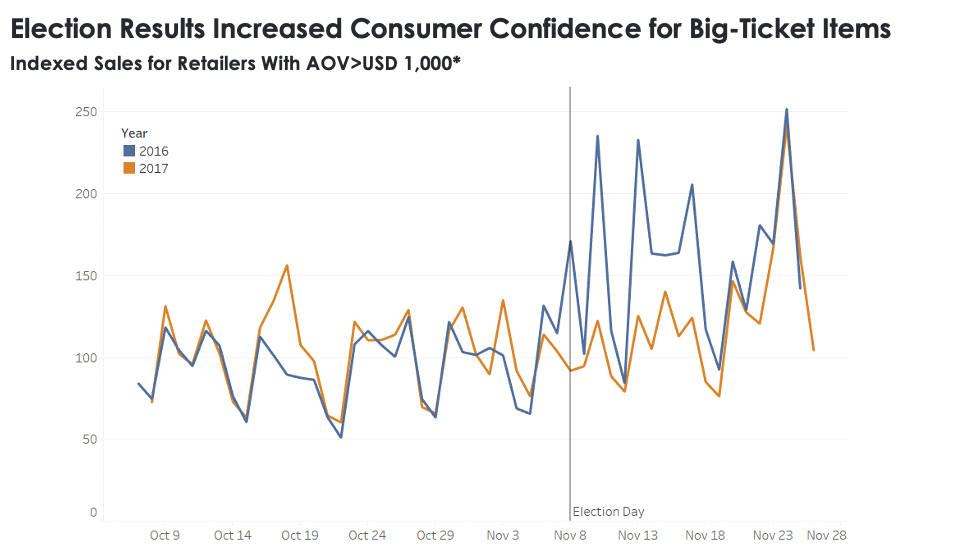
This tells us that even if sales seem to be slowing in the weeks leading up to Election Day, retailers who sell premium or expensive items should be prepared for a potentially seismic shift in purchasing behavior just after. This might include anything from jewelry and luxury apparel to consumer electronics, premium furniture, and more. With the holidays right around the corner, a completed election seems to encourage consumers to relax, enjoy, and treat themselves and their loved ones.
Download our free holiday gifting report here to learn how consumers are planning to buy this holiday season—and how to prepare your business.
2. Consumer interest in car purchases tends to go up after Election Day.
In 2016, leads among our automotive clients, including car aggregators, marketplaces, and new/used dealerships, jumped significantly after Election Day, compared to the four week period from September 8-October 5, 2016.
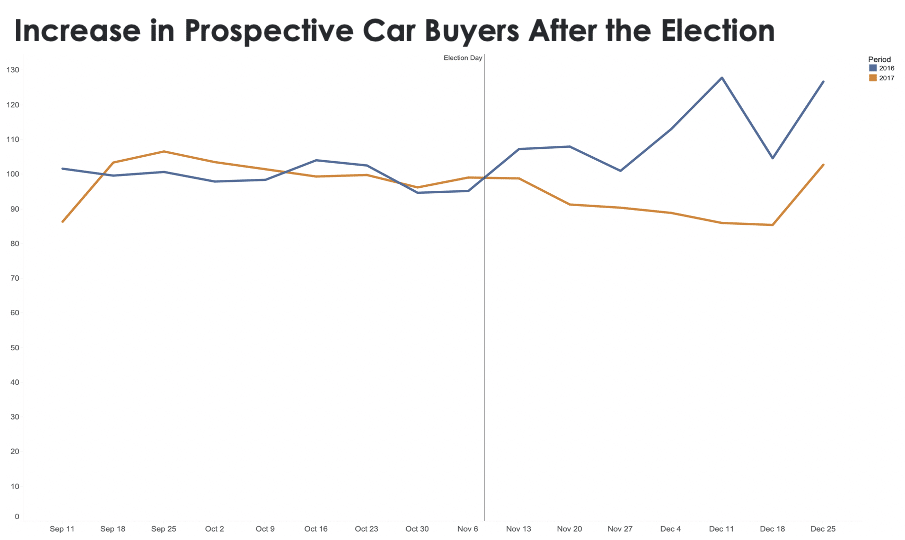
Criteo data shows that US car dealerships have been seeing high activity since this spring, with leads and test drives still up 19% year over year in September 2020.1 In addition, Criteo research shows that ongoing health concerns impacted consumer comfort levels with mass transportation: In our “Peak to Recovery” study conducted in May, 64% of Americans said they’d be wary of planes and trains for some time.2
We expect the election may push even more drivers to make a purchase.
3. In 2016, home purchases declined before Election Day, then bounced back.
Whether it’s because consumers are anticipating a drop in mortgage rates or because they don’t quite know where they’ll want to live, one thing is clear: Having Election Day on the horizon makes consumers pause before buying a home.
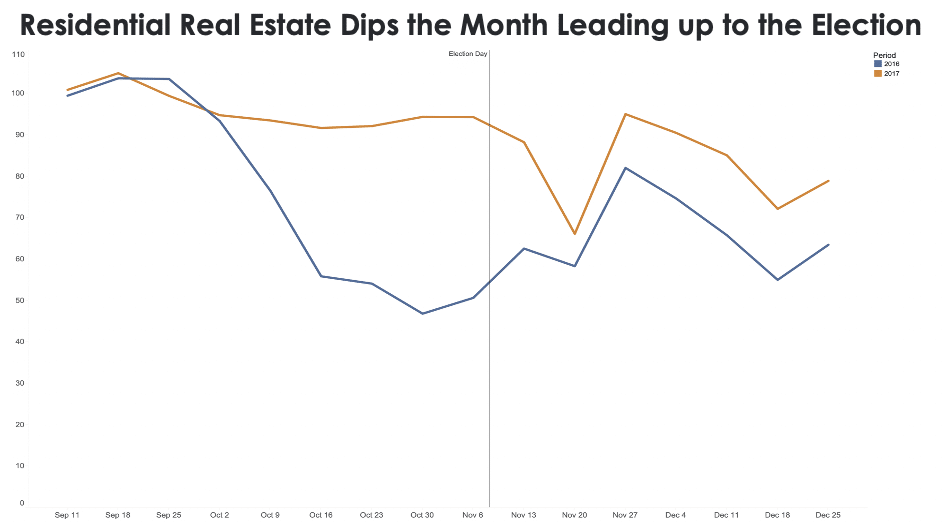
Criteo data shows that in 2016, real estate leads dropped significantly in the month leading up to the election, then recovered. In step with the period when families gather—physically, or perhaps virtually this year—and when the spirit of togetherness abounds, many consumers resume their hunt for a place called “home” right when the holiday season arrives.
Election Day Results Inspire Consumer Confidence
Despite the challenging context of 2020, consumers today are ready to start browsing and buying holiday gifts. A recent Criteo survey shows that 6 in 10 Americans plan to purchase goods specifically for the holiday season.3
Once the results are in after Election Day, shoppers will have one more question mark answered about the future, inspiring confidence just as the holiday season gets into full swing. Brands and retailers have an opportunity to help holiday shoppers find and spend on the perfect gifts for them and their loved ones during the most wonderful time of year.
For more holiday season consumer insights, download our latest guide:
1Automotive New/Used Dealers, United States, until September 27, 2020. Indexed Leads by Week in 2020 compared to Average in Jan 1-28, 2019. Same set of Automotive Players with stable tracking of online leads during the period in 2019 & 2020. App excluded.
2Criteo “Peak to Recovery” Survey. Criteo surveyed 13,532 respondents having experienced partial or complete lockdown at any point within the past few months across 12 countries between May 13 and May 29, 2020 (1,366 in the US). Respondents were asked to evaluate how forced social distancing had affected their daily habits and how they envisaged returning to normal. The sample is representative of the populations of the respective countries by age and gender (ethnicity in the US).
3Criteo Holiday Season Survey, US, August 2020 n=1,547


