Given all the uncertainty surrounding the global pandemic this year, holiday season 2020 will no doubt be very unique. But before we can prepare for the unknowns—like the potential of an autumn Amazon Prime Day, supply chain disruptions, and more—it never hurts to look back at historical holiday trends.
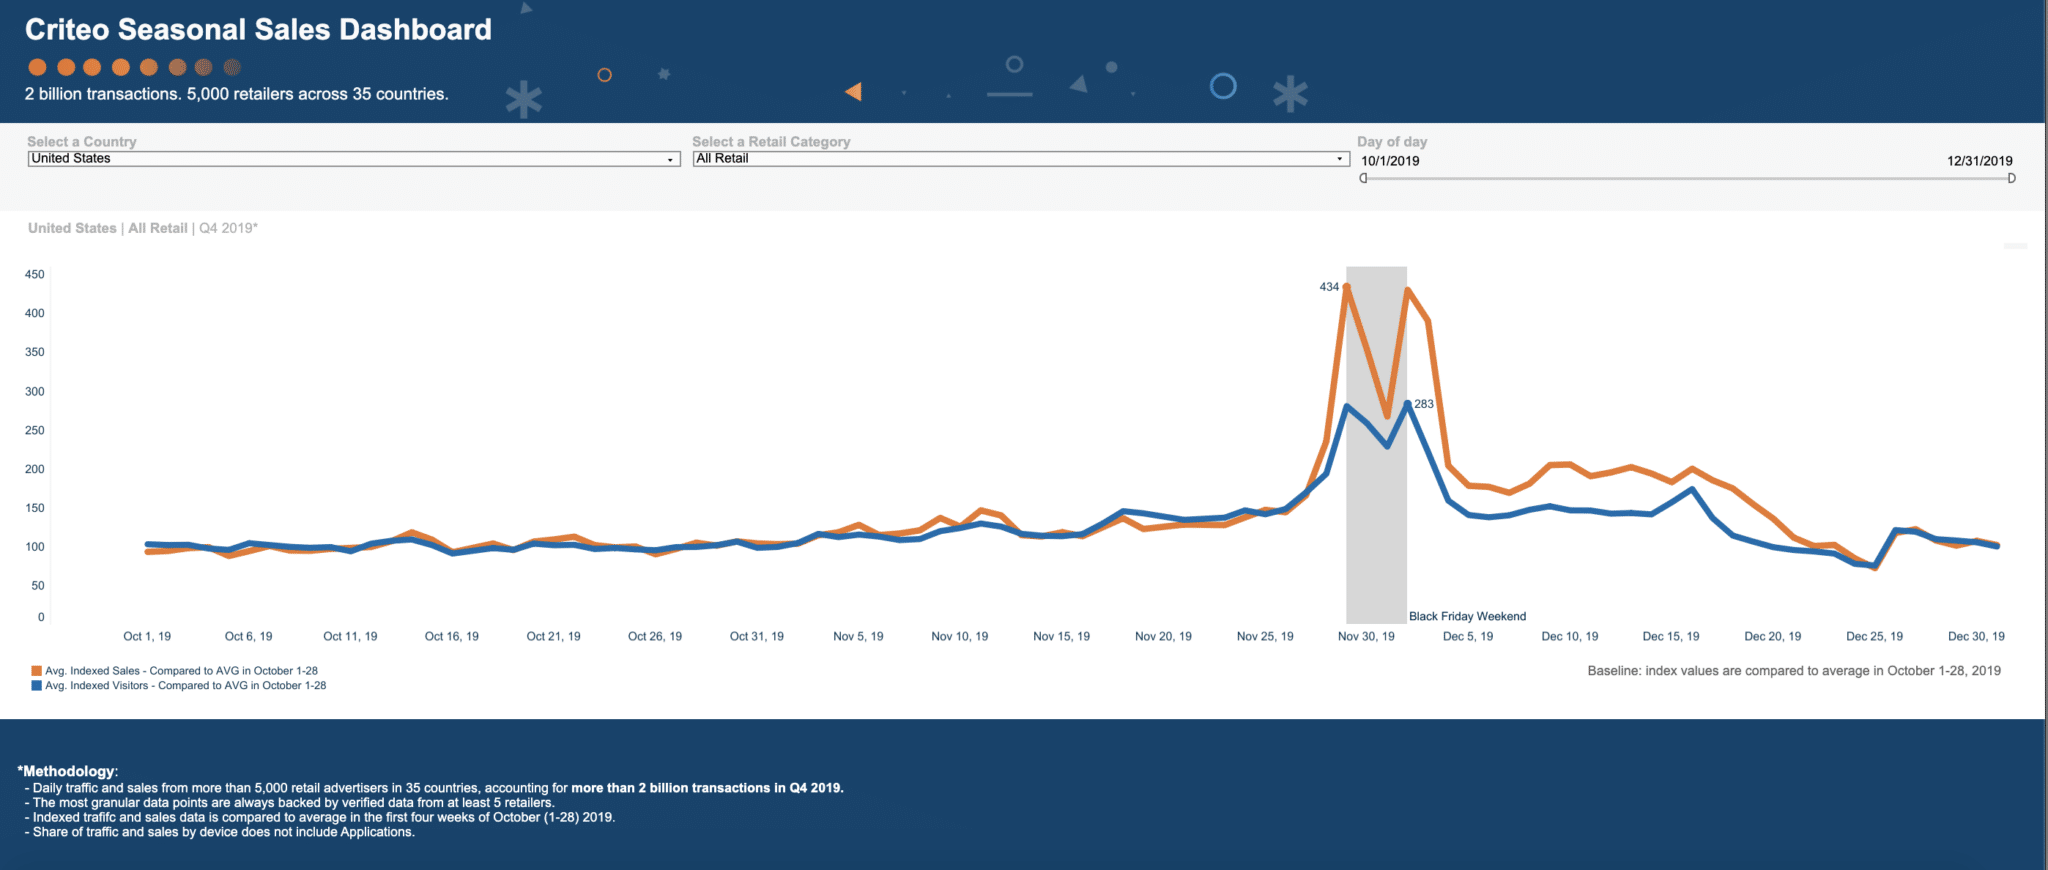
With the Criteo Seasonal Sales Dashboard, you can see what spikes happened last holiday season. Our insights are based on over 2 billion transactions from 5,000 retailers during the last quarter of 2019, so we’re able to show how people bought across different categories. These exclusive insights can help you plan your marketing campaigns for today, tomorrow, and beyond.
The interactive experience is loaded with data on 35 countries and 6 major retail categories (Computing / High Tech, Fashion/Luxury, Health / Beauty, Home Improvement, Mass Merchants, and Sporting Goods).
Inside the dashboard, you can select a country, retail category, and dates to generate a graph. Dynamic data visualizations let you see trends around key seasonal periods around the globe like Diwali, Black Friday, Singles Day, and more. Check it out to see things like:
- Indexed sales
- Indexed site visitors
- Mobile share of sales
Here’s an example with US data:

As our first Holiday 2020 Mini-Guide shows, resonating with today’s consumers throughout their purchase journey is critical. With the help of the Criteo Seasonal Sales Dashboard, you’ll be ready to tackle the months ahead:


