Here at Criteo, we regularly release the latest insights we’ve gathered about product category trends globally, based on our analysis of data from more than two billion active monthly shoppers and 15,000 retailers. During the peak of the pandemic, we also created an interactive tool to give everyone the ability to view, analyze, compare, and contrast the data themselves.
With the Criteo Product Insights Finder, you can see all the ebbs and flows of different retail categories since February 1, 2020, compared to Jan 1-28, 2020, down to the product category level. Our hope is that these insights will continue to help advertisers and publishers adapt and better plan for the future.
Step-by-Step: Using the Criteo Product Insights Finder
The interactive experience is packed with data on 20 countries and 13 major retail categories, encompassing over 600 product sub-categories! To use the Criteo Product Insights Finder, simply follow these steps:
- Select a Country and a Product Category using the dropdown menus.
- Choose the Number of Categories you’d like to see by typing a number into that field.
- Pick a Day Range to see average sales indexes. For example, you could enter “7” to see the average sales indexes of products within the selected category over the last week.
- Move the Slider above the chart to zoom in or out on the graph.
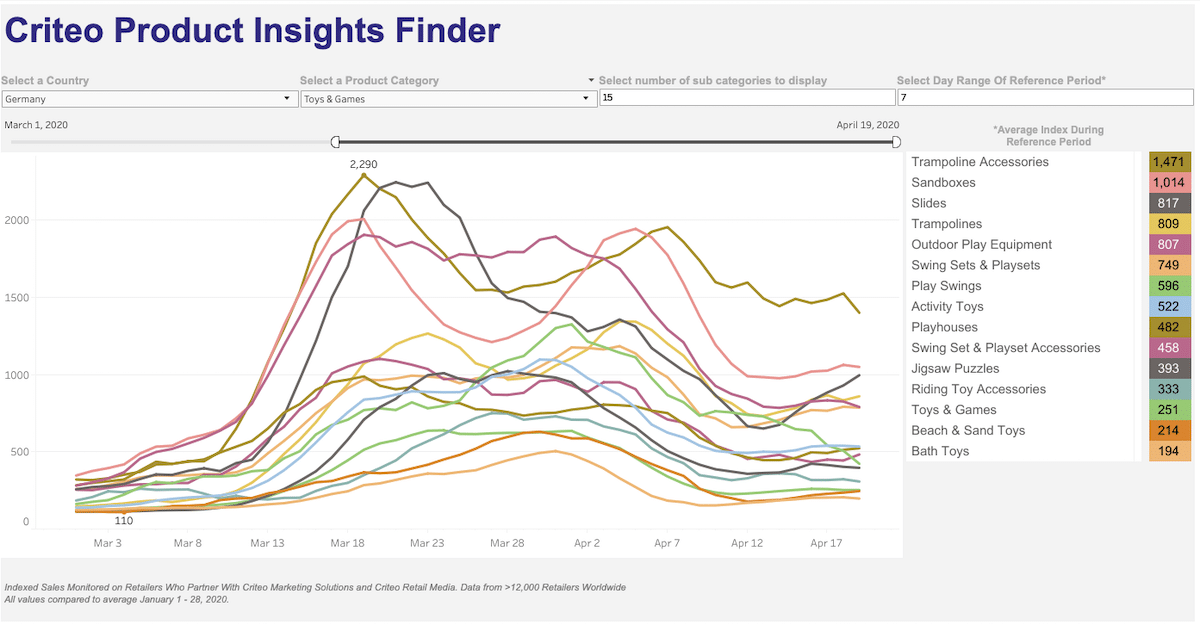
The screenshot below shows Toys & Games product categories in Germany:
Depending on the country you select, you’ll be able to hover over the graph and view indexed sales figures across popular product categories like Apparel & Accessories, Health & Beauty, Electronics, Furniture, Sporting Goods, Toys & Games, Arts & Entertainment, Animals & Pet Supplies, and more!
How to Interpret the Data
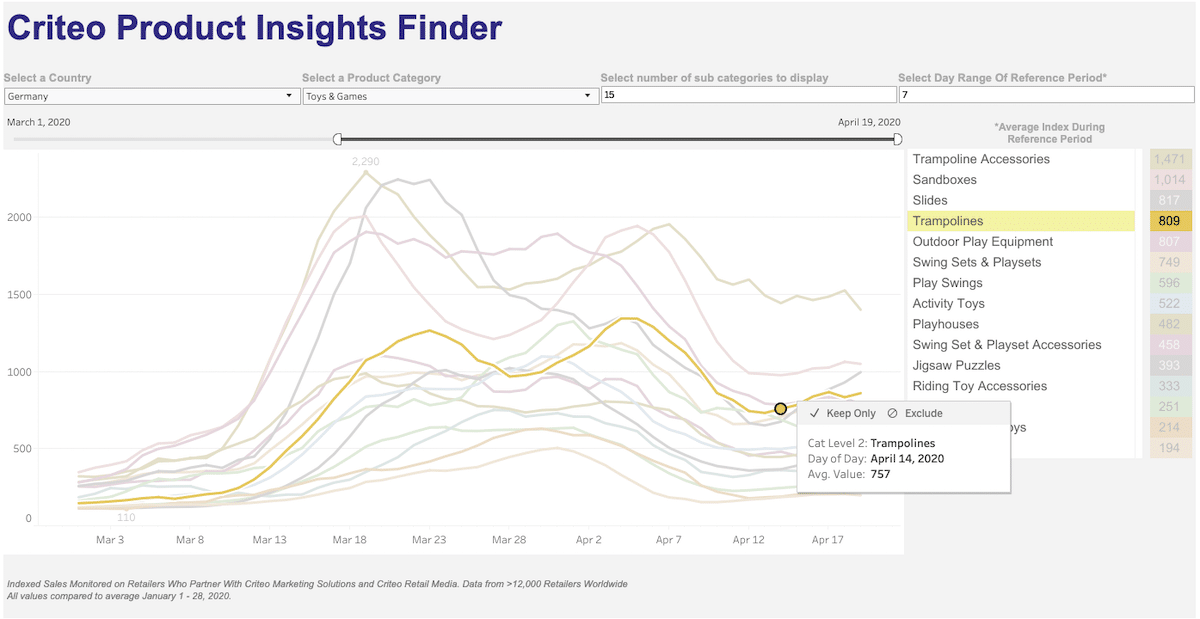
Let’s stick with the German example. On April 14 the “Trampolines” category was indexing at 757 in our data. This means that if we saw, on average, 100 sales per day of Trampolines from January 1-28 (the baseline), and then we saw 757 sales of Trampolines on April 14, we could say that sales of Trampolines increased by 657% in Germany on April 14.
On the right hand side, you’ll see product sub-categories ranked in order of average indexed sales growth during the reference period chosen (in this case the 7 days from April 13-19). This does not mean Trampolines were ranked #4 in terms of total sales, it means Trampolines were ranked #4 in terms of sales growth that week, compared to Jan 1-28, at an average sales index of 809, behind Trampoline Accessories (average index of 1,471), Sandboxes (average index of 1,014), and Slides (average index of 817). That’s a lot of fun happening in Germany!
Jigsaw Puzzles, by contrast, might have gone from 1000 sales to 3930 sales, for an index of 393. Thus, Jigsaw Puzzles could have a higher absolute sales count, but our charts are based on growth rates.
Sharing the Insights With Others
You have the option to download a spreadsheet, image, or PDF with the raw numbers. Just hover over the icons in the bottom right corner to do so, then share the output with your work colleagues, company leadership, and geeky friends!
As our Consumer Insights Dashboard shows, resonating in a social distancing economy with mostly-at-home consumers is critical. By understanding consumer behavior and leveraging the Criteo Product Insights Finder, you and your business will be better prepared to face any challenges ahead.


